Google analytics and Google tag manager
Looking for end-user support?
This area is for Super Administrators and others interested in the overall management of WordPress sites and networks that we host.
>> Search our end-user support documentation here.
We have built many tools on top of WordPress that are available to our users.
Below is our documentation on how to use the tools that are intended for Super Admin users.
Table of Contents
Google Analytics
As a Super Admin, you can enable Google Analytics to track visitor data across all sites on your CampusPress network. Our Google Analytics is powered by the WPMU DEV Beehive Pro plugin.
Once set up it automatically displays data that your users can refer to for their site in Statistics + GTM > Google Analytics > Statistics.
Set up Google Analytics Account
The first step is to set up your Google Analytics account.
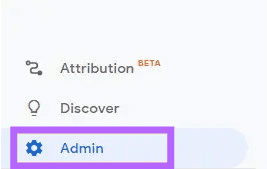
If you already have a Google Analytics account set up and want to use that one, you need to log into your Google Analytics account. Click on the Admin button on the bottom left corner of your Google Analytics screen.
Now click on Create Property.

Then follow the same steps below for a new Google Analytics account after the Start Measuring step.
If you don’t already have a Google Analytics account you need to go to the Google Analytics page and sign into Google Analytics using a gmail account that you want to connect with Statistics on your CampusPress network. Use a generic gmail account that can be shared with other staff in your webteam.
Click on Start Measuring.

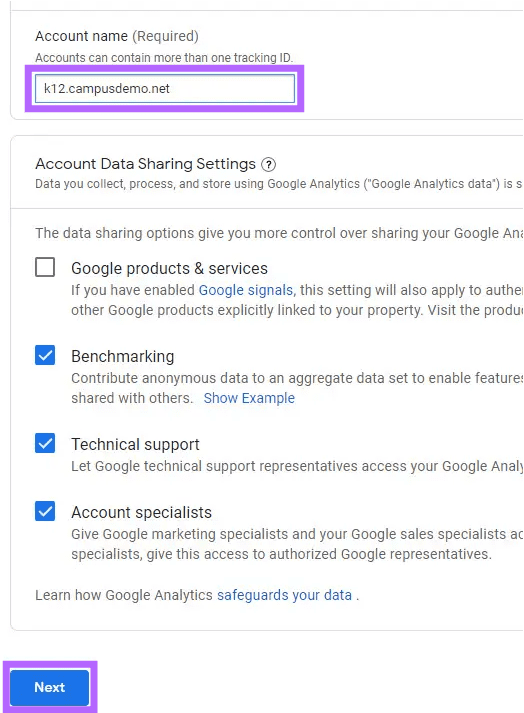
Add your account name and click Next.
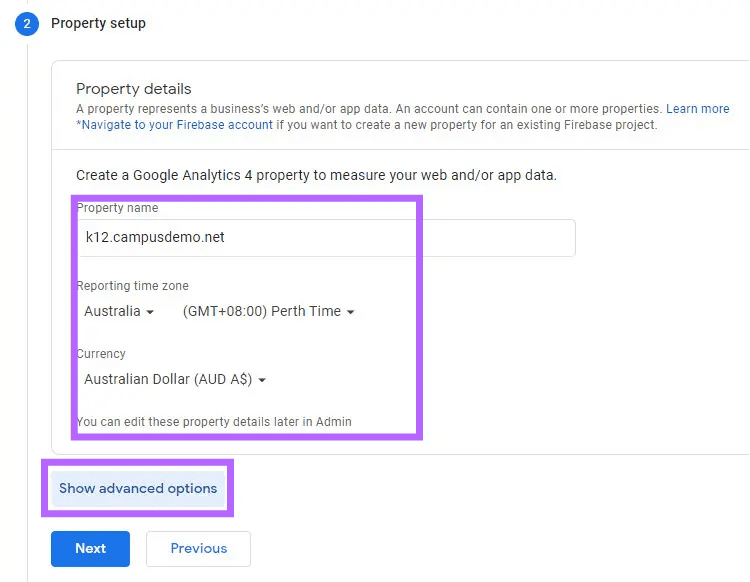
Add your Property name, select your reporting time zone and currency then click on Show Advanced Options.
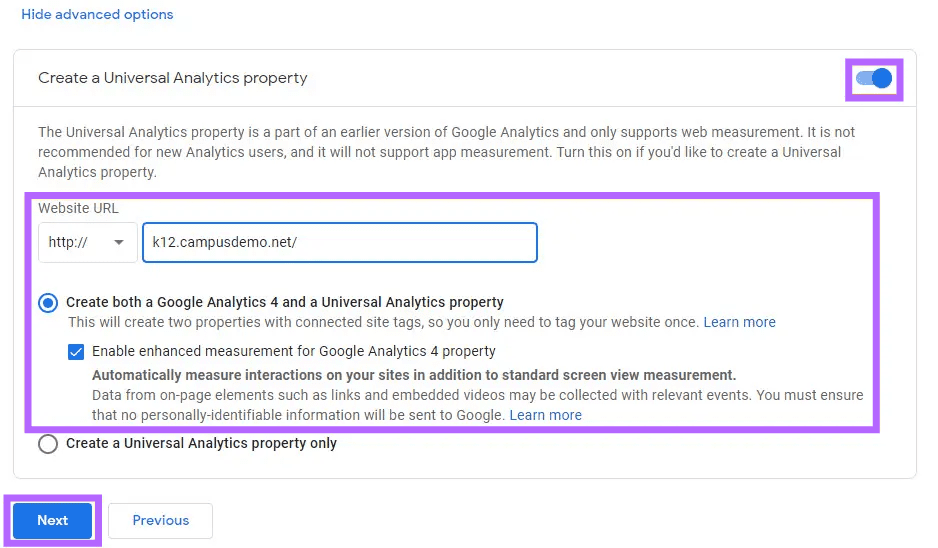
Click on the toggle to a Create Universal Analytics Property. Add your website URL, select Create both a Google Analytics 4 and a Universal Analytics Property and select Enable enhanced measurements for Google Analytics property then click Next.
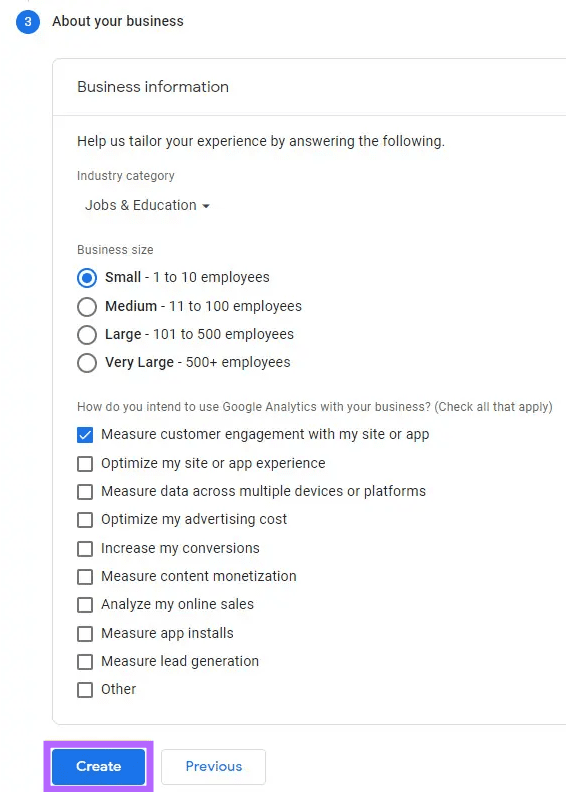
Complete the business information and click Create.
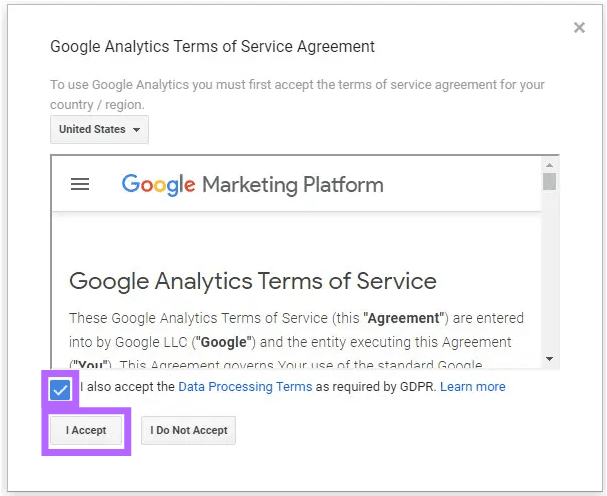
Click I Accept to Google Analytics Terms of Service.
Connect To Google Analytics account
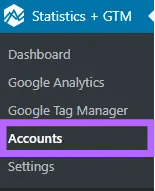
Now go to Statistics + GTM > Accounts in the network admin dashboard.
Click on Connect with Google.

Sign into the gmail account you set up Google Analytics on and click Allow.

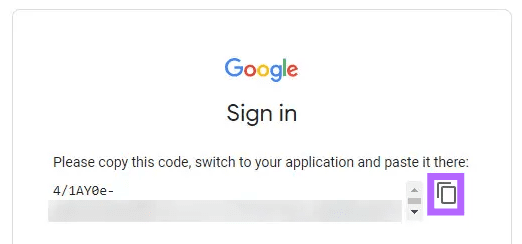
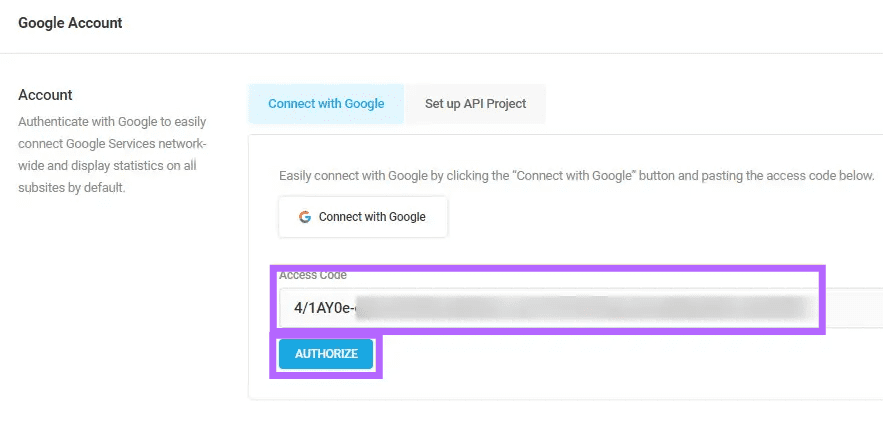
Copy the Google sign in code.
Paste the access code into the access code field and click Authorize.
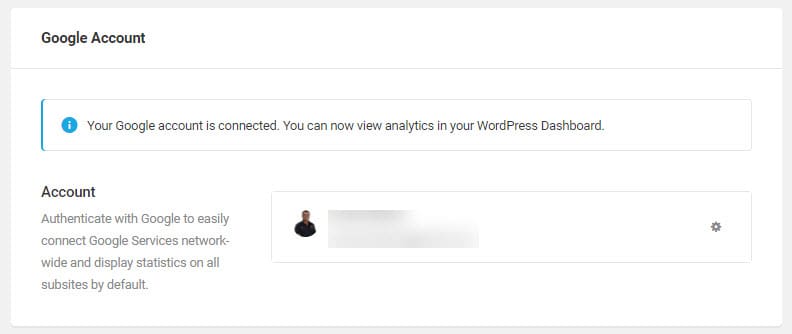
Your Google account should now be connected.
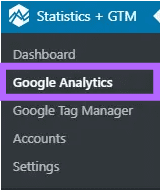
Go to Statistics + GTM > Google Analytics in the network admin dashboard.
Click on the Accounts tab.

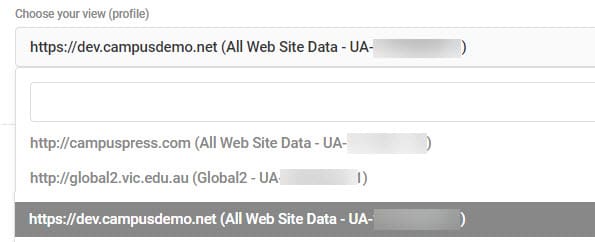
You should see your profile displayed under Analytics profile and your Tracking ID displayed under Network Tracking. The two tracking IDs should match.
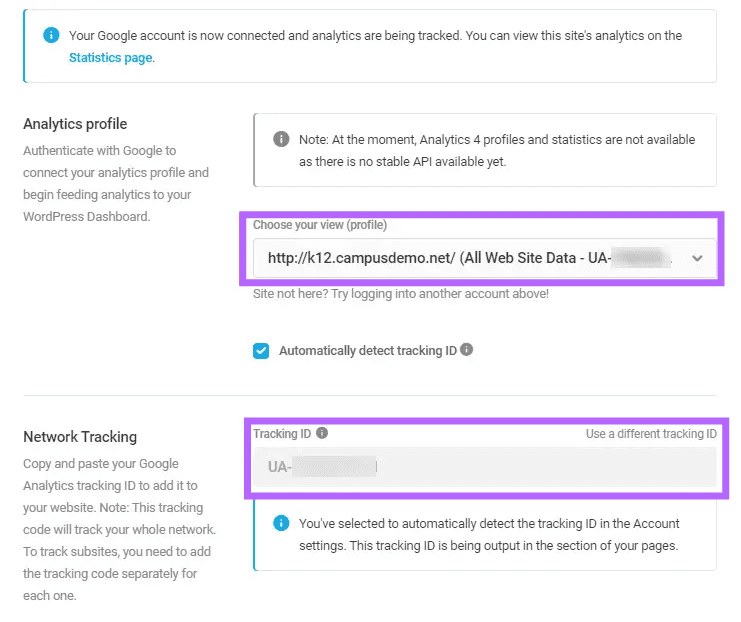
If you have multiple profiles set up in your Google Analytics account you may need to select the Analytics Profile from the drop down menu that matches your Network tracking ID and then click Save Changes.
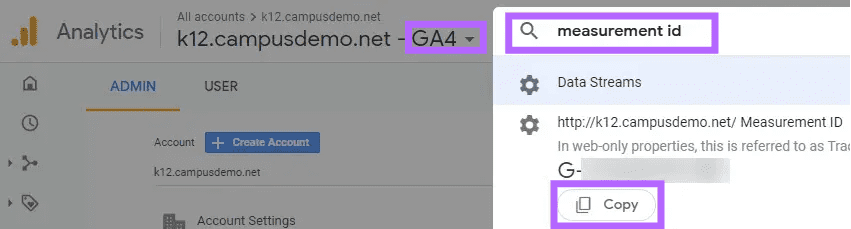
Go to your GA4 profile in your Google Analytics account, type Measurement ID in search and copy your Measurement ID.
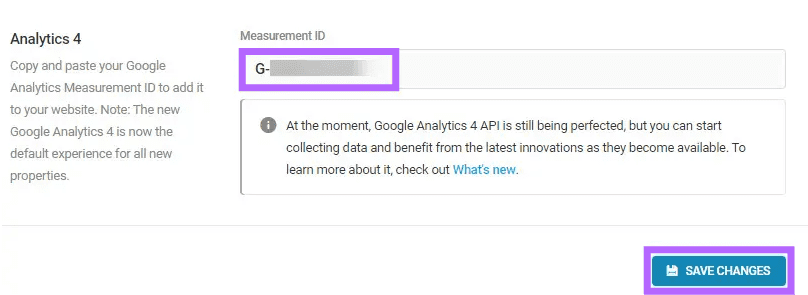
Paste your measurement ID into the Analytics 4 Field in Statistics + GTM > Google Analytics > Accounts and click Save Changes.
It may take 24-48 hours before stats start to appear in Statistics + GTM > Dashboard in dashboard of all sites on your network once you’ve set up the account.
View Google Analytics Data
Google Analytics data for your entire CampusPress network can be viewed in Statistics + GTM > Dashboard in the network admin dashboard.
You can also check Google Analytics data for any site hosted on your CampusPress by going to Statistics + GTM > Dashboard in the dashboard of the site you are interested in.
The Statistics + GTM Dashboard is comprised of three modules:
- Overview – snapshot of the site’s traffic for a specified period of time.
- Statistics – snapshot of the site’s Google Analytics data with a link to view the full report.
- Google Tag Manager – displays current status of Google Tag manager integration.
Overview
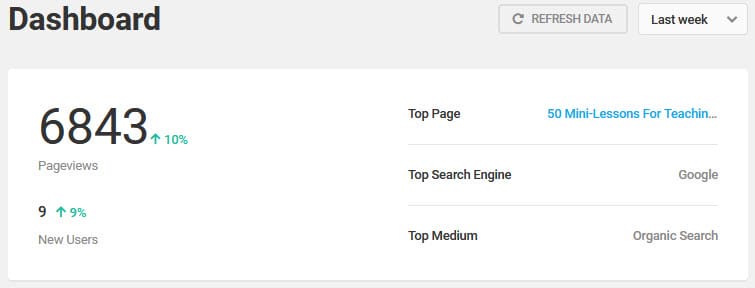
- Time Frame Filter – Used to filter to display traffic and activity stats for a day, week, month or custom range.
- Pageviews – Displays the number of unique page views during the selected time frame, along with the percentage change during that same period.
- New Users – The number of new users during the selected time frame, along with the percentage change during that same period.
- Top Page – The most visited page during the selected time frame.
- Top Search Engine – The search engine that generated the most traffic for a site during the selected time frame.
- Top Medium – The path that generated the most traffic (direct, organic search, referrals, paid, etc.) during the selected time frame.
Statistics
The Statistics module provides a snapshot of the site’s Google Analytics data.
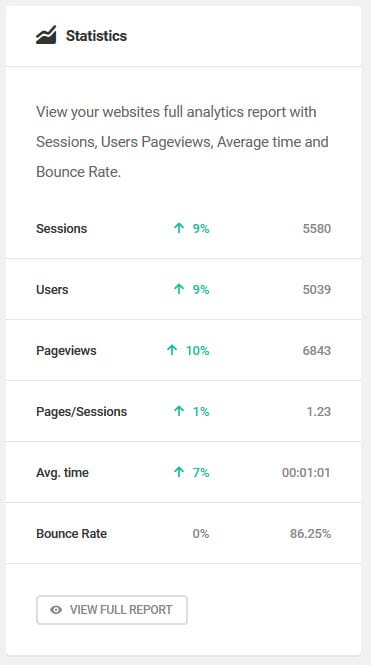
When you click on View Full Report you are taken to Statistics + GTM > Google Analytics > Statistics which allows you to view the detailed stats from one area.
If you see a message like “It may take up to 24 hours for data to begin feeding. Please check back soon.” it can mean:
- You haven’t waited 24 to 48 hours after configuring Google analytics and you need to wait a bit longer.
- Google Analytics hasn’t been correctly configured. Go to Accounts in the dashboard of the site to see if the user has tried to set up Google Analytics and it has been configured incorrectly. Double check Google Analytics is configured correctly in the network admin dashboard.
- The traffic to the site is too low to display data. Try changing the date range in Statistics + GTM > Google Analytics > Statistics to see if that helps.
Visitors
The Visitors panel displays traffic and activity data across multiple metrics. By default, it displays the visitors per session. Click on any of the metrics beneath the Visitors chart to view a chart for that metric.
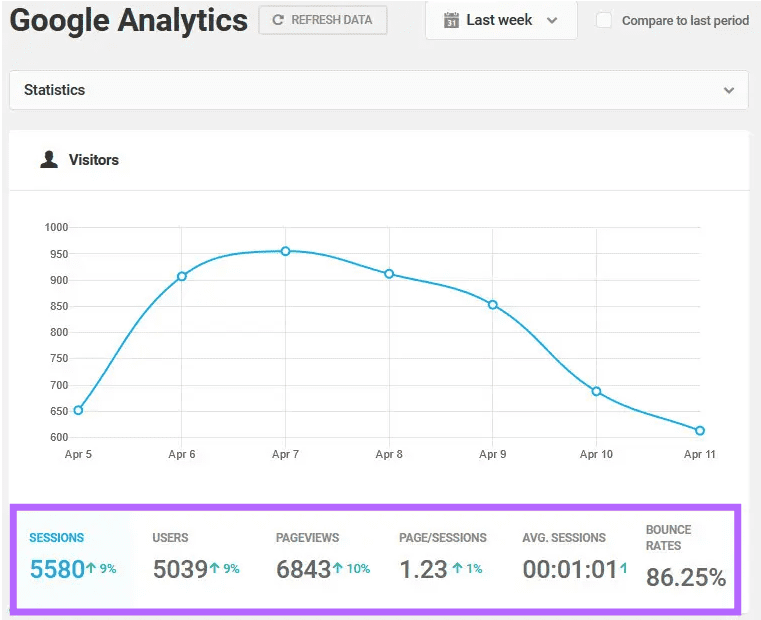
These metrics are:
- Sessions – The number of unique user sessions during the selected time frame. A session is defined as a group of user interactions with your website that takes place within a given time frame.
- Users – The number of unique individual users who interacted with a site during the selected time frame.
- Pageviews – The number of pages that were fully loaded into a browser at the request of users. A user who views five pages in one session will result in a single session and five pageviews.
- Pages/Session – The average number of pages users viewed during a single session.
- Average Time – The average amount of time users spent interacting with a site during a single session.
- Bounce rate – A bounce occurs when a user leaves a site shortly after arriving without interacting with any elements on the page. The bounce rate is the number of these events as a percentage of all sessions during the selected time frame.
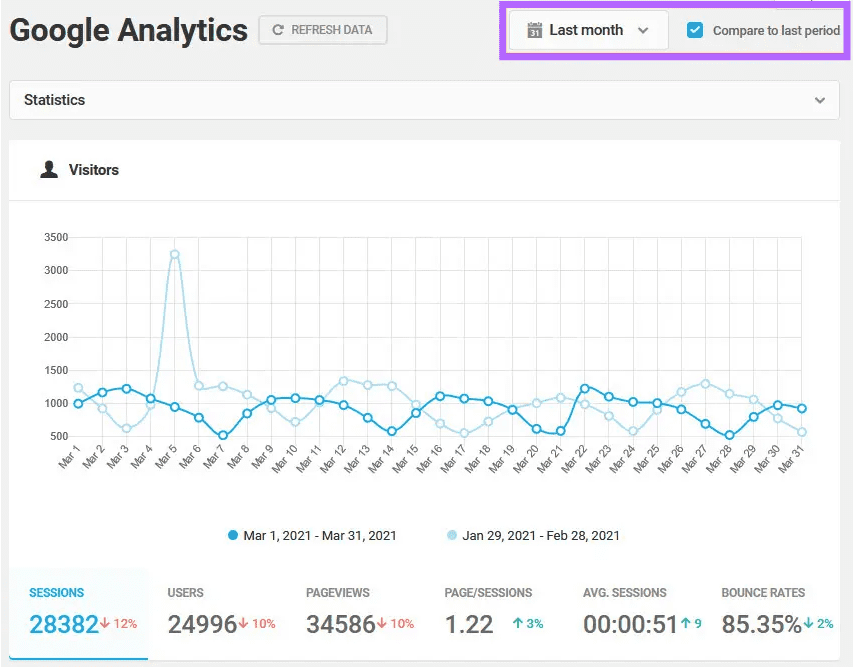
Selecting Compare to last period displays the data for the current period for that metric with the previous time frame.
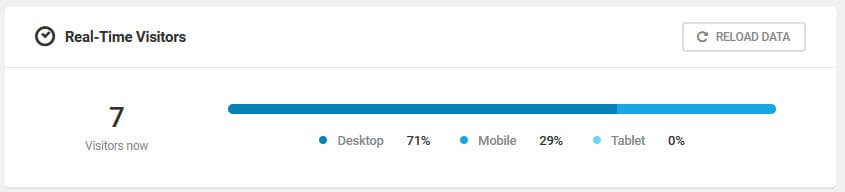
Real time Visitors
The Real time visitors module displays the current site’s visitors categorized by device.
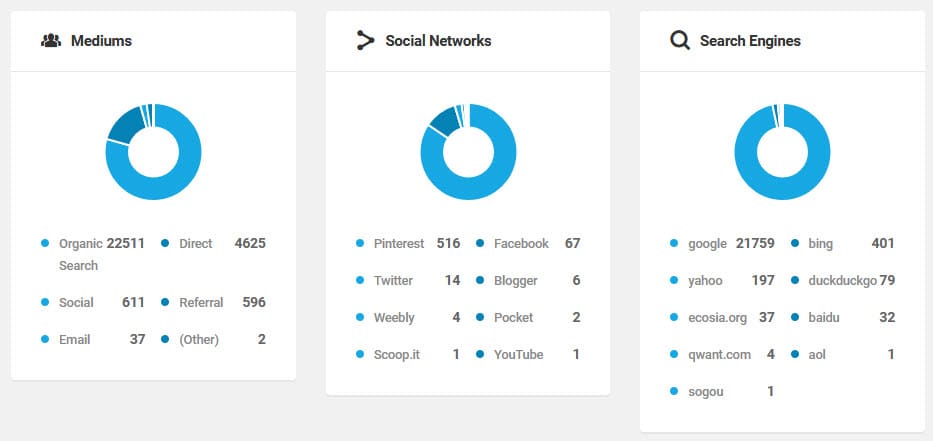
Mediums, Social Networks and Search Engines
- Medium – The various sources for site traffic: organic, direct, referral, and so on.
- Social Networks – Traffic that was referred to a site from a social network.
- Search Engines – A ranking of search engines based on the amount of traffic derived from those sources.
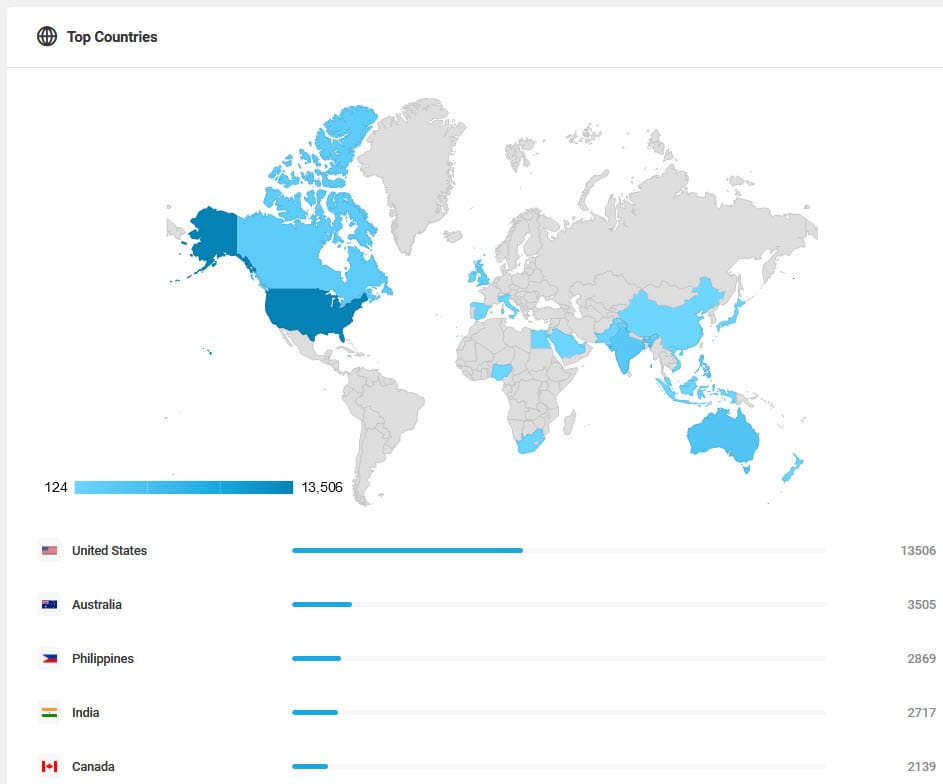
Top Countries
The top countries module displays where traffic is coming from to the site and the number of visitors from each country for the selected time frame.
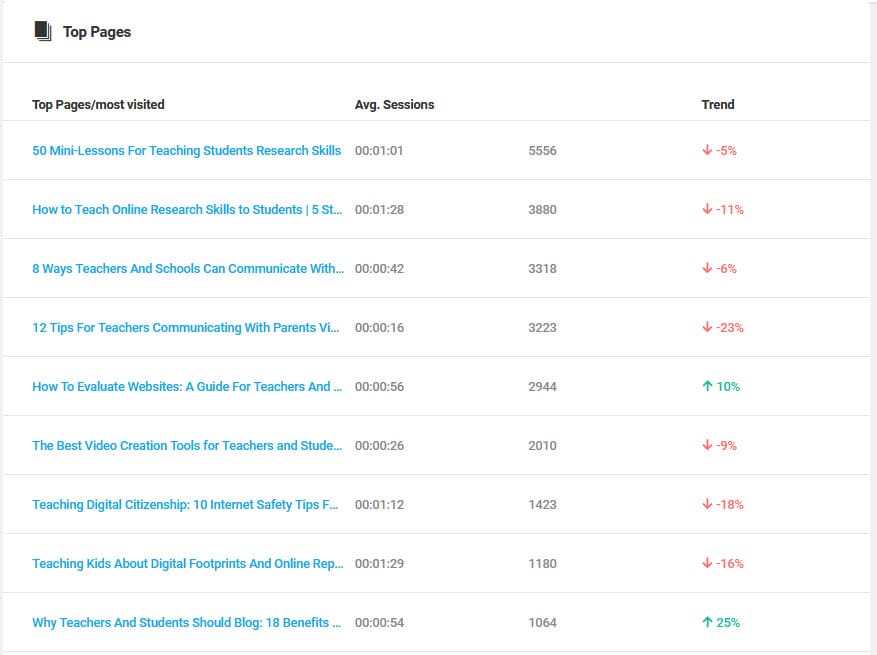
Top Pages
The top pages module lists the site’s most visited pages and the number of visitors who viewed the pages during the selected time period, as well as the average amount of time users spent on that page and the percent change since the previous period.
For more detailed analysis of your Google Analytics data log into your Google Analytics page.
Warning
Do not set up filters for GA property used for WP dashboard statistics as it may corrupt data.
Google Tag Manager
The Google Tag Manager module in Statistics + GTM > Dashboard in the network admin dashboard allows you to connect to your Google Tag Manager account. If you’ve already integrated Google Analytics with Google Tag Manager you don’t need to connect Analytics to Beehive; the Tag Manager container you connect will handle that for you.
Click Activate to activate the integration.