Grafana Monitoring Dashboard
The Grafana monitoring dashboard gives your team a private, view-only, live view of your CampusPress platform’s performance, traffic and security. It’s a paid add-on available to clients on a dedicated cluster. To add it to your plan, contact our Sales team.
Table of Contents
Getting Started
Signing In
- Open your dashboard link from CampusPress.
- Sign in with your institution’s SSO, using the same login you use for other campus services.
Only people your institution has given access can sign in. Your access is view-only: you can explore every panel, but you can’t change the dashboard or your platform.
The Dashboard at a Glance
The dashboard has three rows. Each covers your whole dedicated network, not individual sites.
- Top row (capacity): how busy your web servers are and how many are running
- System Metrics (database): how quickly your database responds and how busy it is
- Application (traffic and performance): requests, errors, page response time and top traffic sources
Using the Dashboard
The controls in the top-right corner of the dashboard, plus a few features on each panel, let you choose what period you’re looking at and explore the data.

Time Range Picker
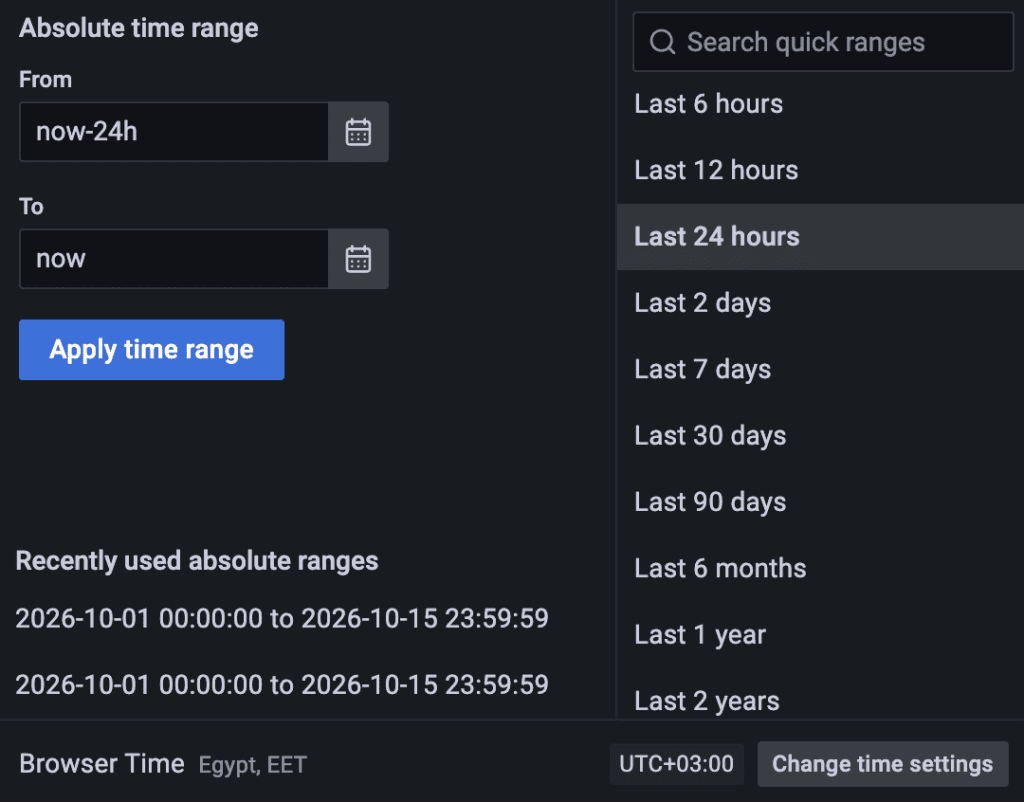
The time range picker shows the period the dashboard currently displays, for example “Last 24 hours.” All panels update to match the range you choose.
- Relative ranges: click the time range picker and pick a preset, such as Last 30 minutes or Last 7 days. You can also type a custom value, for example now-12h for the last 12 hours.
- Absolute ranges: enter a From and To date and time, or pick dates from the calendar, then click Apply time range. Recently used ranges are listed for quick access.
- Zoom in: click and drag horizontally across any graph to zoom into that period.
- Zoom out: click the Zoom out button (magnifying glass) next to the time range picker, or double-click a graph.
Refresh and Auto-Refresh
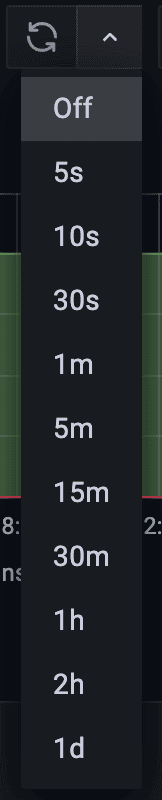
The dashboard doesn’t refresh automatically by default.
- Refresh now: click the Refresh button to load the latest data into all panels.
- Auto-refresh: click the arrow next to the Refresh button and choose how often the dashboard reloads, from every 5 seconds (5s) to once a day (1d). Choose Off to stop auto-refresh.
Time Zone Setting
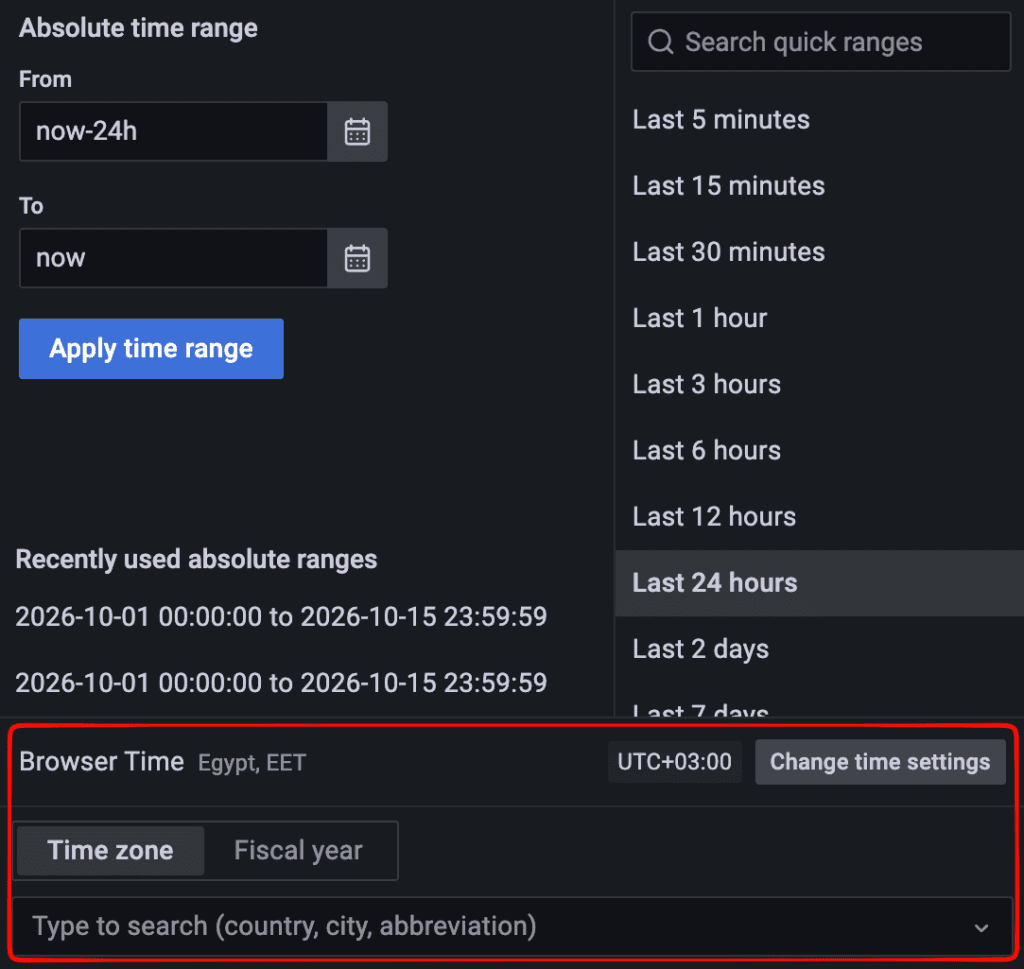
To change the time zone the dashboard uses, open the time range picker and click Change time settings, then choose a time zone.
Legends
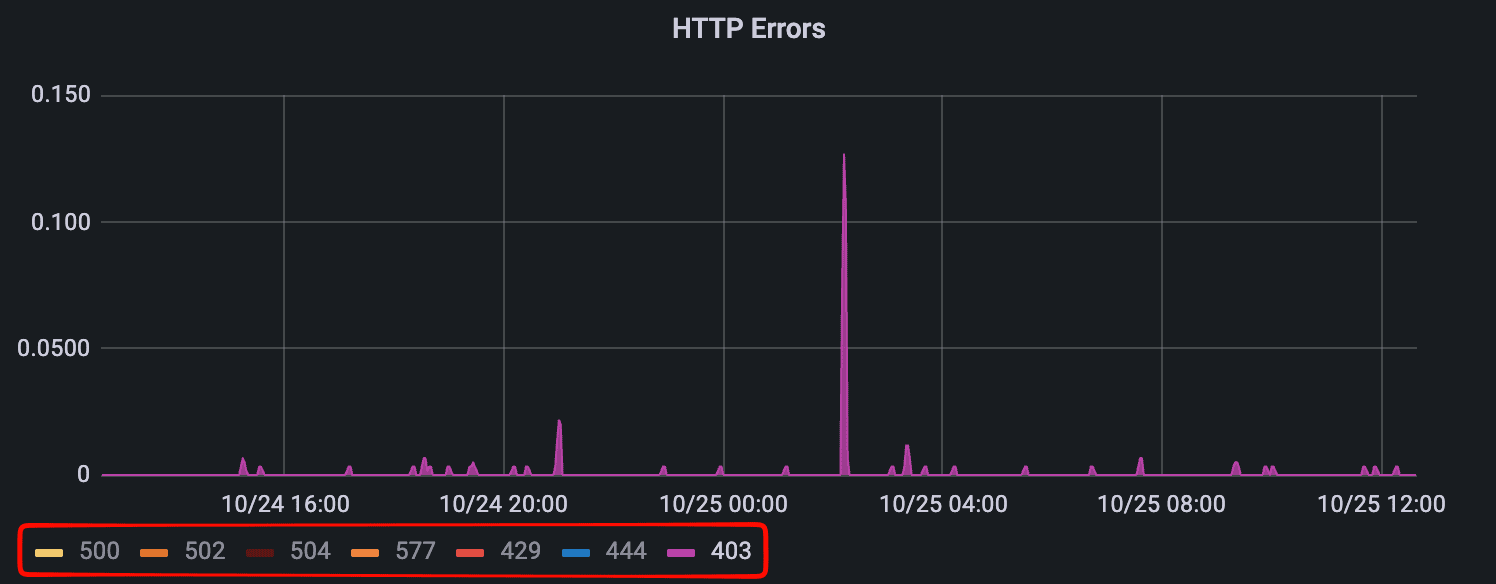
The legend below each graph lists the data series shown, for example Writer and Reader(s) on the DB CPU panel.
- Show one series only: click a series name in the legend. All other series are hidden.
- Add series back: hold Ctrl (Windows/Linux) or Cmd (Mac) and click another series name.
- Show all series again: click any series name twice.
Tooltips
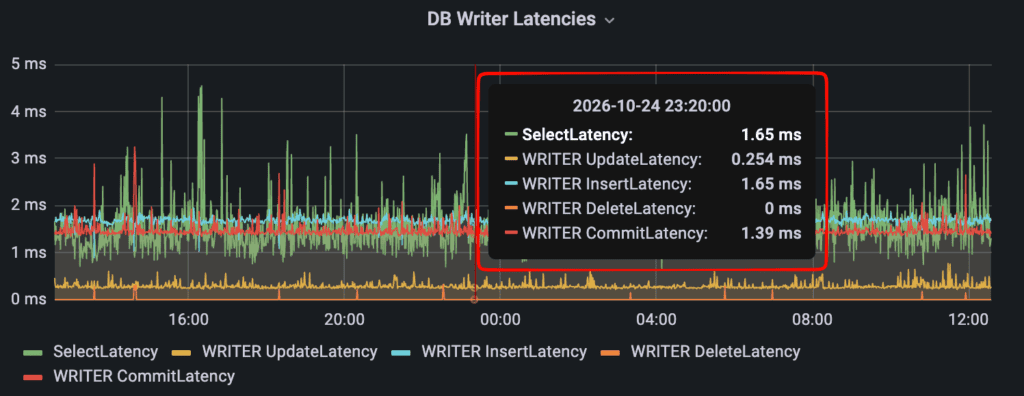
Hover over any graph to see a tooltip with the exact values at that point in time, along with the date and time.
Panel Menu
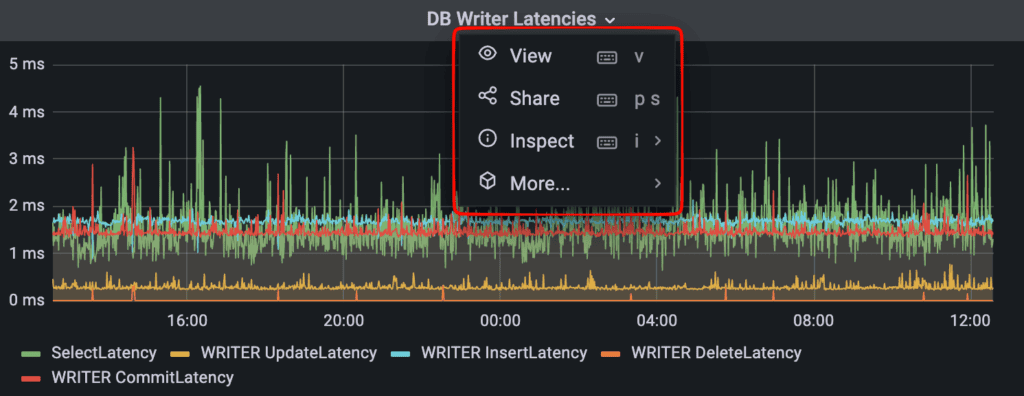
Click a panel’s title to open the panel menu:
- View: opens the panel in full screen. Press Esc to return to the dashboard.
- Share: creates a link to the panel.
- Inspect: hover over Inspect and choose Data or Panel JSON. Either option opens the Inspect sidebar for that panel.
Kiosk Mode
Kiosk mode hides the menus and navigation bar, so the dashboard fills the screen. It’s useful for displaying the dashboard on a wall screen or monitor.
- Turn it on: click the Cycle view mode icon (the monitor icon) in the top-right corner of the dashboard.
- First click: hides the side menu on the left.
- Second click: enters kiosk mode.
- Turn it off: press Esc.

Understanding the Panels
The dashboard is organized in three rows: Capacity at the top, System Metrics (the database) in the middle, and Application (traffic and performance) at the bottom. All panels show data for your whole dedicated cluster, not individual sites.
Top Row: Capacity
Your sites run on a group of web servers that grows and shrinks with demand. This is called auto-scaling. The top row shows how busy those servers are and how many are running.
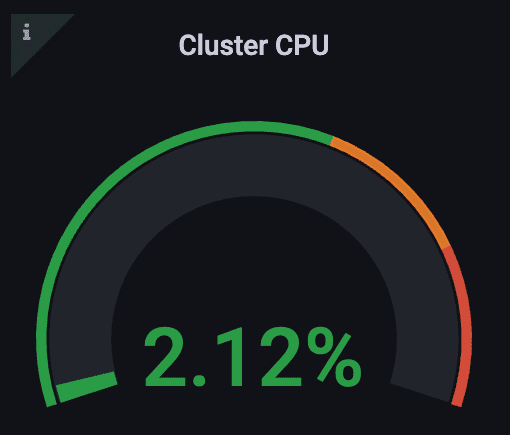
Cluster CPU
- What it shows: the current CPU usage across all your web servers, as a percentage.
- How to read it: this gauge always shows the value right now, whatever time range you’ve selected. CPU usage is the main signal the platform uses to decide when to add servers.
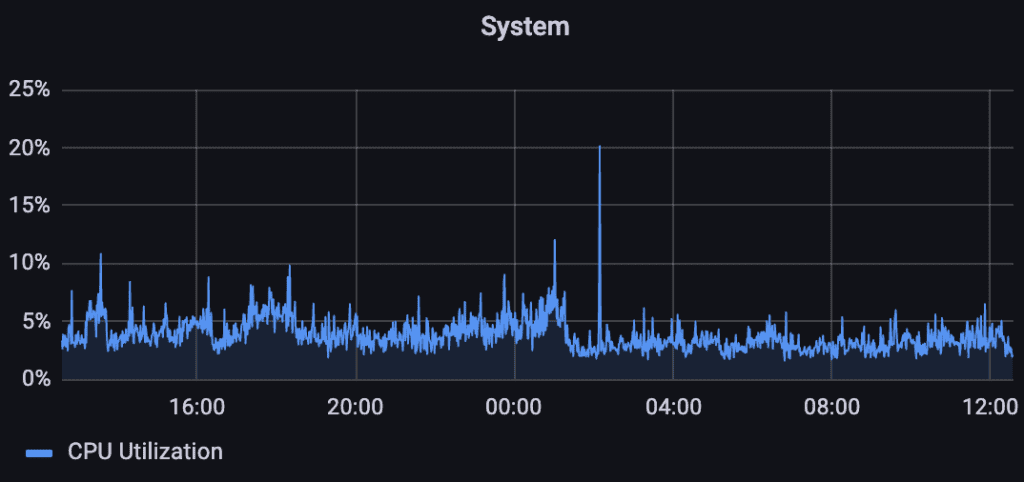
System
- What it shows: CPU usage across your web servers over the selected time range (the CPU Utilization line).
- How to read it: short spikes are normal. When high CPU usage lasts, the platform adds servers automatically, which you’ll see in the Autoscaling History panel.
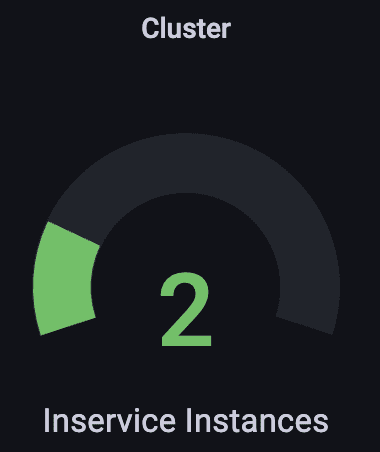
Cluster
- What it shows: the number of web servers serving your sites right now (Inservice Instances).
- How to read it: like Cluster CPU, this gauge always shows the current value.
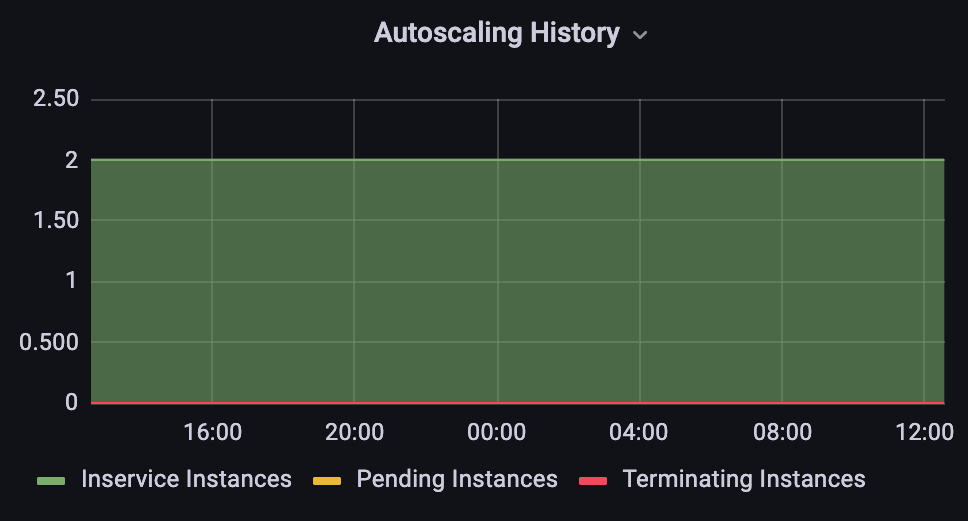
Autoscaling History
- What it shows: the number of web servers over the selected time range, as three series:
- Inservice Instances: servers actively serving your sites
- Pending Instances: servers being added
- Terminating Instances: servers being removed
- How to read it: pending and terminating spikes show the platform scaling up or down to match traffic. Seeing them is normal and means auto-scaling is working.
- Note: values can show decimals (e.g. 2.13). Each data point is an average over a short period, so a decimal means the number of servers changed during that period. Zoom into a shorter time range to see whole numbers.
System Metrics: Database
Your database runs as a cluster: a main writer database plus one or more reader copies that share the load.
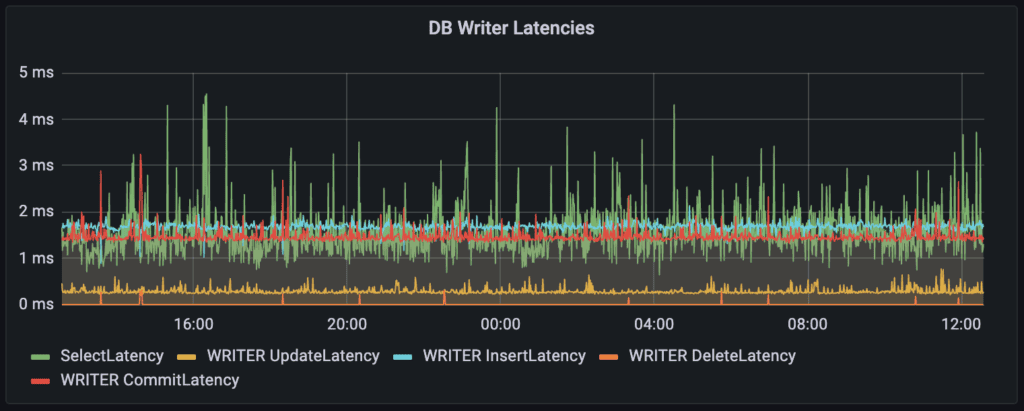
DB Writer Latencies
- What it shows: how long the main (writer) database takes to complete operations, in milliseconds. There are five series:
- SelectLatency: looking up data, e.g. loading a post
- WRITER UpdateLatency: changing existing data, e.g. editing a page
- WRITER InsertLatency: adding new data, e.g. a new post or comment
- WRITER DeleteLatency: removing data, e.g. deleting a post or comment
- WRITER CommitLatency: confirming that changes are saved, e.g. after publishing or updating a post
- How to read it: lower is better. Every change goes through the writer, so its latency is the best single indicator of overall database health.
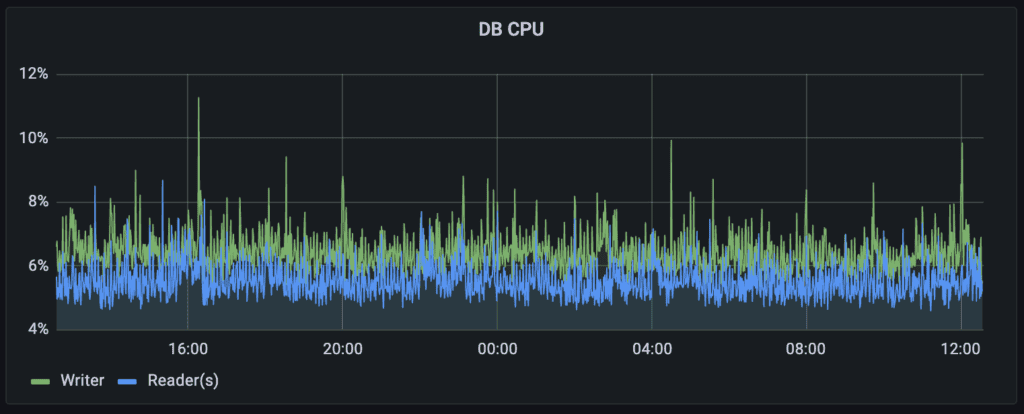
DB CPU
- What it shows: CPU usage of the database, as a percentage, for the Writer and the Reader(s).
- How to read it: consistently high database CPU is a sign the database may need more capacity. We monitor this on our side.
Application: Traffic and Performance
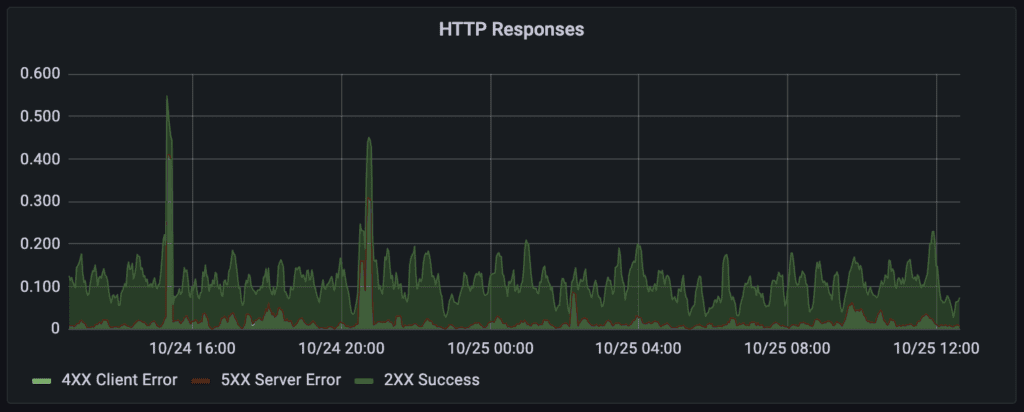
HTTP Responses
- What it shows: the rate of requests your sites answer, grouped by result:
- 2XX Success: pages served successfully
- 4XX Client Error: requests that were refused or couldn’t be found (for example, a missing page or a blocked request)
- 5XX Server Error: requests that failed on the server
- How to read it: values are rates (requests per second), not totals, smoothed so trends are easier to see. Rates show how fast something is happening, which makes sudden changes such as a traffic spike or an attack easy to spot.
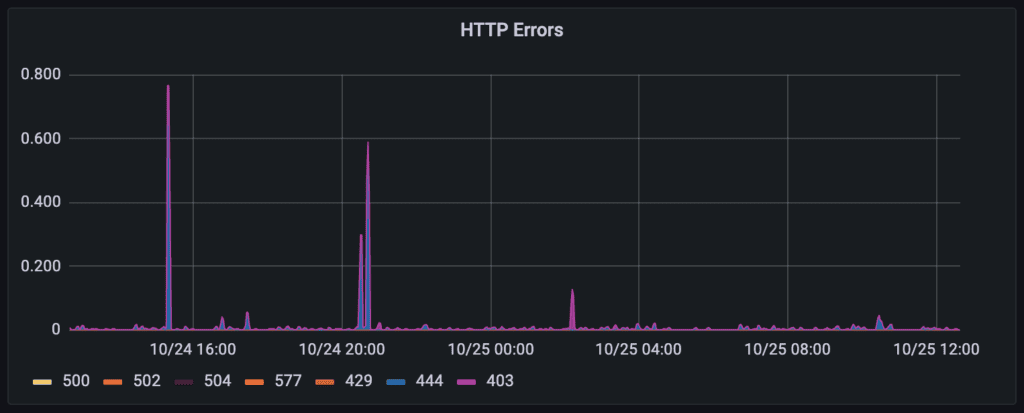
HTTP Errors
- What it shows: a breakdown of specific error codes, as rates:
- 403: Request blocked by our web application firewall (ModSecurity)
- 429: Too many requests: the visitor was rate-limited
- 444: Request blocked by our bot protection
- 500: Internal server error
- 502: Bad gateway: the server got an invalid response while handling the request
- 504: Gateway timeout: the request took too long to process
- How to read it: 403, 429 and 444 usually mean the platform’s protections are blocking unwanted traffic, often bots. Rising 5xx errors are worth flagging to our support team.
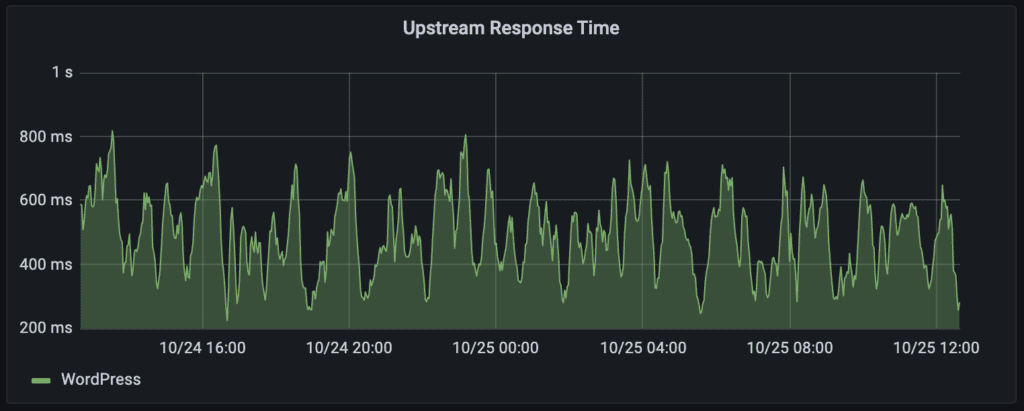
Upstream Response Time
- What it shows: the average time WordPress takes to generate a response.
- How to read it: lower is better. A sustained rise means pages are taking longer to generate, so compare it with the System and DB panels to see where the load is.
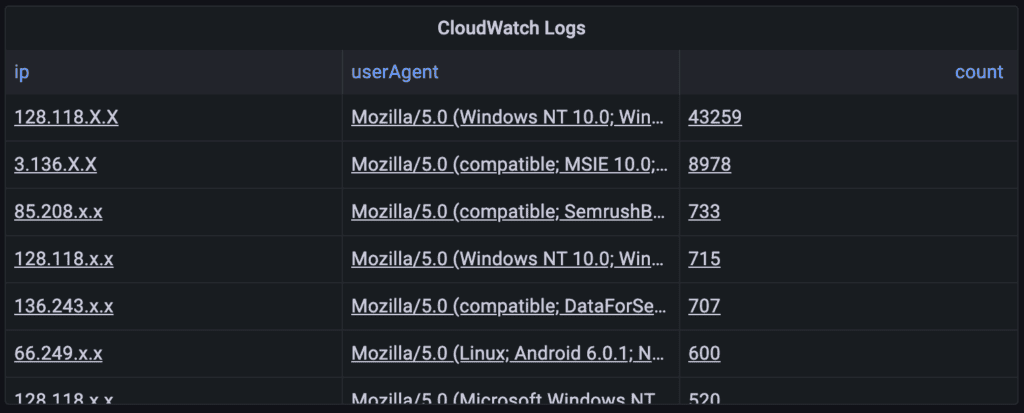
CloudWatch Logs
- What it shows: a table of the top 50 IP address and user-agent pairs by number of requests, taken from your access logs. A user agent identifies the browser or bot making the request.
- How to read it: most top entries are usually automated traffic (bots and crawlers), not human visitors. It’s useful for spotting unusually heavy traffic from a single source.