
Digital storytelling is the practice of using various forms of multimedia, such as videos, images, audio recordings, and interactive elements, to present ideas and stories. We are no longer bound to rely only on text to explain our concepts and ideas in our writing.
It can be used as an educational tool, a marketing tool, or simply for entertainment purposes.
Traditional online articles are now becoming interactive storytelling experiences. For example, we now can transform a text-heavy list of dates and events into an interactive timeline that allows readers to take part in the storytelling process.
There is a variety of digital storytelling tools available on the web that can be embedded into a WordPress website. Below, I have discussed my top five digital storytelling tools and how they help create more interactive experiences for readers.
TimelineJS
Website: https://timeline.knightlab.com/
Text-based timelines can be boring and unengaging for readers. TimelineJS is a free, open-source tool created by the Knight Lab at Northwestern University. This tool allows users to create responsive, media-rich, and interactive timelines without requiring sophisticated coding skills. Timeline can be created by using the Google Spreadsheet template provided on the TimelineJS website to add dates and information, and the tool works great for individual and group collaboration.
TimelineJS Example
StoryMapJS
Website: https://storymap.knightlab.com/
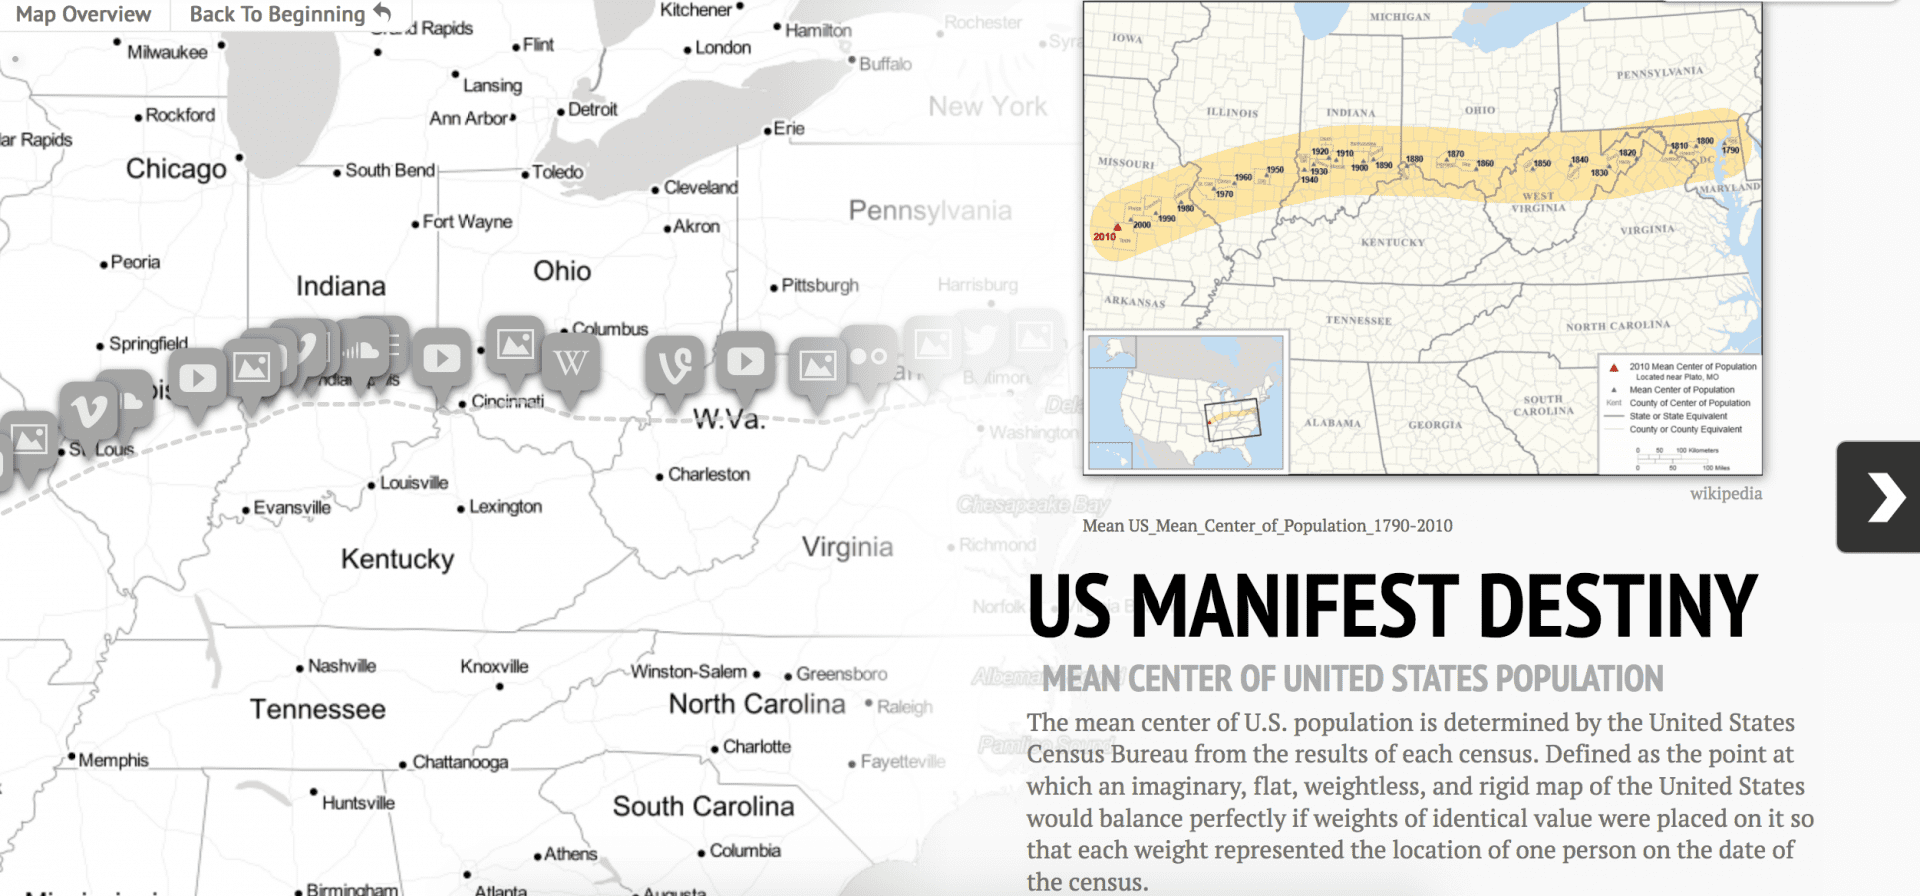
It can be challenging to find tools that support map-based and linear narratives. One tool you may be familiar with is Google Maps. Google Maps is a great mapping annotation tool for nonlinear narratives. However, Google Maps does not allow you to choose the reader’s path from one map marker to the next.
StoryMapJS, another storytelling tool from the creators of Timeline JS, allows you to create linear narratives. It is a free, open-source tool that uses maps to tell stories. You can arrange the map markers in a predefined order for viewers, as seen in the screenshot below. When the readers interact with the map, they are presented with a map on the left and some text along with embedded media on the right.
One challenge I encountered when using StoryMapJS is the inability to collaborate with users when creating a StoryMap. Unlike TimelineJS, where you can collaborate on a Google Spreadsheet, StoryMapJS doesn’t have that feature. StoryMapJS is best suited when you are the only person working on the project.
Canva
Website: https://www.canva.com/
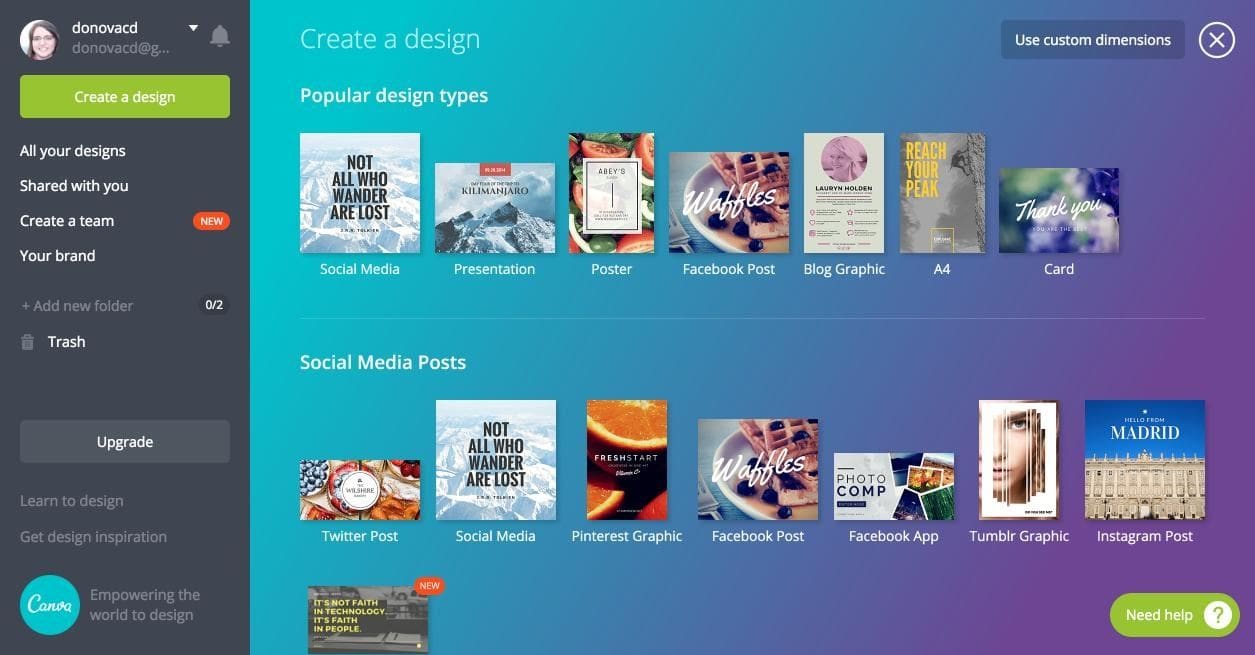
Unless your school has access to the Adobe Creative Cloud subscription, it can be hard to find an inexpensive and high-quality image editing software to use in your classroom. Canva is a free tool for creating and editing images for both print and web. This tool allows users to create a variety of graphics with an easy-to-use interface and a large selection of templates, layouts, icons, and fonts to choose from. Canva has been used in various ways in the classrooms such as creating promotional print materials, infographics, blog images, photo collages, and logos.
Canva provides some great resources such as lesson plans and workshops for teachers looking to integrate Canva into their classrooms.
Piktochart
Website: https://piktochart.com/
Depending on your background, you may find it challenging to design an infographic. Typically, infographics require some graphic design expertise and time for brainstorming and planning the layout of your design. Piktochart is an easy-to-use platform for creating interactive infographics for the web and static versions for print. When creating an infographic, you have the option to start with either a blank or a pre-designed template. The pre-designed templates allow you to focus more on collecting data and communicating your message to readers and less on the design.
Piktochart also provides a large selection of articles in the education section of their blog, which can be found here. A few articles I found useful are listed below.
- One Pager Templates for Your Classroom Activities
- How to Use Piktochart in Any (and Every) Classroom
ThingLink
Website: https://www.thinglink.com/
Sometimes, in the storytelling process, it can be helpful to display an image with annotations or hotspots that link to additional information. This feature is often referred to as an image map. Image maps require a lot of time and knowledge of HTML and CSS to create a seamless experience for users. Fortunately, ThingLink makes this process easier for content creators. ThingLink is a simple-to-use image and video annotation tool that allows users to create content-rich interactive images and videos. Free accounts only allow you to annotate an image using text, images, and URLs. However, they do offer discounted plans for teachers to explore additional features such as 360° and virtual reality editors. Check out ThingLink’s Blog for resources and examples of projects used in the classroom.
The digital storytelling tools discussed are suitable for classrooms ranging from grade school to graduate school. They are user-friendly and enable educators, teachers, and content creators to invest more time in crafting their message and less time in mastering the technology.